Nightstalker314 is back and looking into the numbers of TWW Season 1 once again, this time focusing on how things went for each individual region. He’ll be taking particular note of Chinese player changes due to their WoW getting temporarily shut down and how that affected the stats.
The Focus
Last time we discussed the perception of this first season of M+ underperforming while looking at the completed runs and general activity across all key levels. This time our focus is on active characters and the metrics across different regions. Similar to part 1, there are several factors taken into context which show once again that this season was performing quite well.
From general regional metrics to patterns of behavior, we will be analyzing data provided by Raider.IO. Given the focus on the impact of Chinese players on the collected data, we will be comparing The War Within Season 1 and Dragonflight Season 3 specifically since they had the same duration of 23 weeks and showing the difference between peak Chinese activity on Taiwanese servers and the complete lack thereof.
What Are the Major Changes From Season to Season?
Raider.IO gathers its data via the armory API from regional servers for EU, US & Oceania, Korea, and Taiwan. Usually Chinese players can provide their data manually to Raider.IO. Between January of 2023 (DF S1) and June of 2024 (DF S4) this wasn’t the case and for the seasons in between you will see no entries for those servers. Instead, tens if not hundreds of thousands of Chinese players were playing on Taiwanese servers and therefore boosting the metrics for that region by up to factor 10. And we have to assume that not everyone who would usually play WoW and participate in M+ would do this. Yet we saw a clear indicator of how popular this game feature is among Chinese players.
Timed Run Regional Data Breakdown
The most obvious impression taken from this data is the massive surge and decline of Taiwanese metrics during all Dragonflight seasons. SL S4 and DF S4 of course show lower interest in general. Looking at weekly breakdowns of total runs and the curve of active characters throughout DF S4 you can even observe the effect the Pandaria Remix had on that season. Activity dropped by almost 30% during that time.
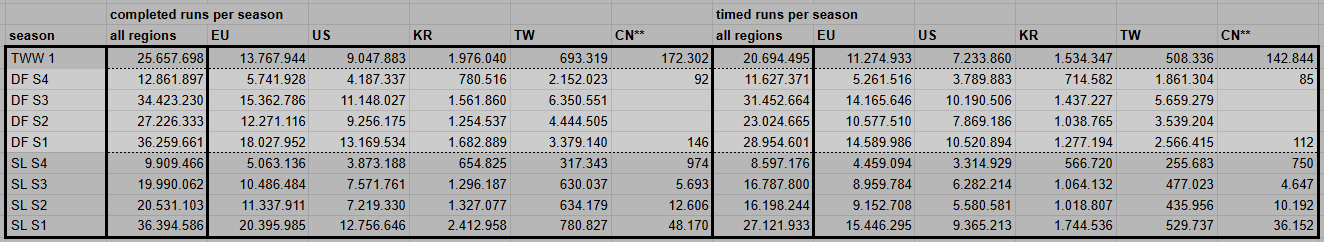
If we compare each region to the global value we can see a certain pattern for regions in general. Outside of the Dragonflight anomaly EU and US have a split somewhere around 55% and 35%, Korea is hovering between 6,.5% and 8%, and Taiwan between 2,2% and 3,.2%. During Dragonflight Season 3, the impact of the Chinese players brought that number up to 18,45%, basically 6 times as high than it had ever been before.
The in time % for each region also shows some consistency. The EU is usually slightly ahead of the US, followed by Korea and Taiwan which is at times falling quite behind. It seems that players over there are more committed to finishing their keys. In addition, a higher portion of high level keys (a topic we will get to later) also impacts this metric.
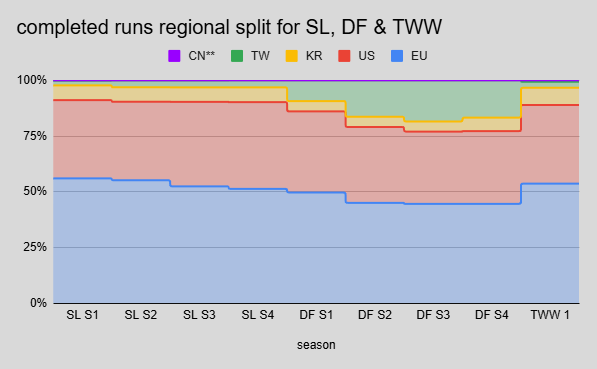
If we fill this breakdown into a graph it becomes quite obvious how massive the influence of the Chinese players was during Dragonflight. For the first time in WoW history, we got a decent comparison regarding their activity in M+, albeit only the ones that went over to Taiwanese servers.
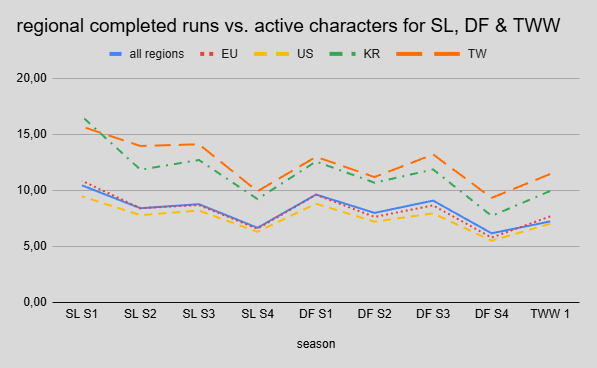
Active Characters Per Region
In addition, we can also look at the amount of active characters per region. Here we see that – regardless of the implementation of Delves and the removal of low level keys – a comparable amount of characters were still active in M+ during TWW S1.
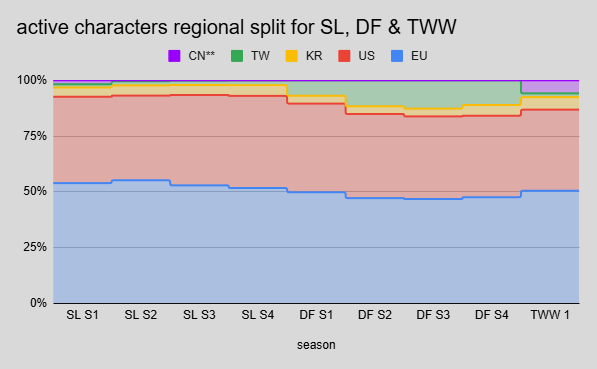
In general, the EU and US once again show a relatively stable split of 50-55% and 36-41%, respectively. Korea is hovering between 3,5% and 5.6% and Taiwan is boosted from just below 2% up to a massive 12,7% during Dragonflight Season 3. This correlates quite well with the increase of runs during the same season by a factor of 6. Chinese players seem to have been registering more accounts during TWW S1 and dragged a massive amount of around 200,000 random players into the data with a lot of PuG runs.
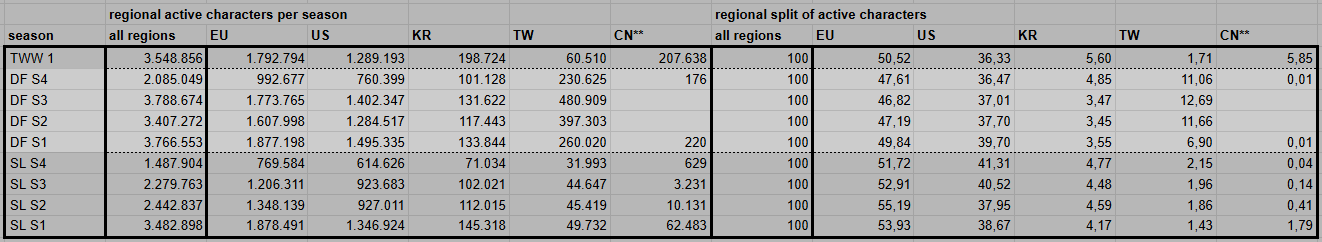
Another graph representing the breakdown clearly points out the surge during DF and the recently added Chinese characters in TWW S1.
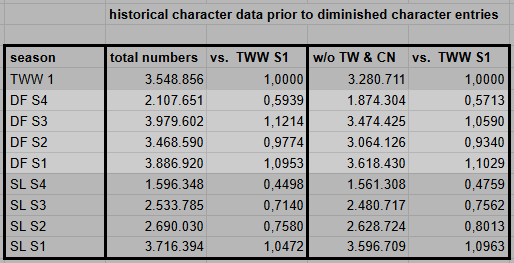
Since the influx of fragmented Chinese data makes a comparison from season to season rather inaccurate, we can isolate the 3 other regions for each season. In addition, we have to mention that the leaderboard data gathered by Raider.IO depends on armory profiles. If these become inactive (no login for more than 2 years) or deleted, those characters are removed from the lists. In general, each list is losing a couple hundred if not thousand entries per week, especially once a season has started more than 2 years ago. I’ve been tracking this phenomenon for almost a year now. The SL seasons as well as most of the DF seasons have lost quite a few entries since I took a snapshot of their peaks, respectively the highest value when starting this observation.
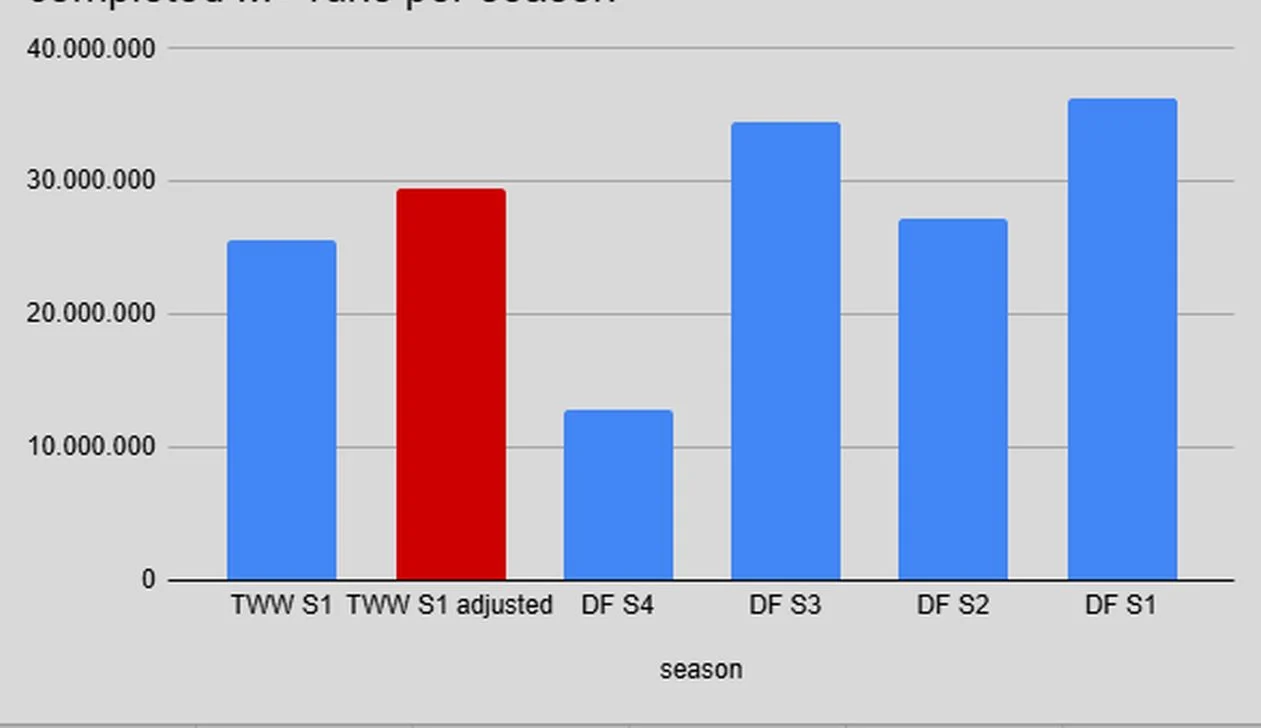
There is a clear difference between the absolute numbers excluding data from TW and CN but the factor from comparing TWW S1 to other seasons clearly diminishes. And the rather dominant DF S3 ends up just 5.9% ahead of TWW S1 while DF S1 is ahead by 10.3%. Both these seasons also match up quite well in comparison, since they are 23 and 21 weeks in length. SL S1 with 30 weeks has quite the advantage when it comes to having more run time and usually more characters.
This comparison works quite well in general even if it isn’t 100% accurate. Leaving out Taiwanese players doesn’t shift much since they are somewhere around 2% in any season. This should be reliable even during the DF seasons for which we removed the artificial increase that isn’t measurable in other seasons since we never get full access to all Chinese data. So overall TWW S1 isn’t falling behind quite that much.
If we now compare the completed runs per season with the character count another pattern emerges. In general, low engagement seasons or those with fewer weeks (SL S4 and DF S4) show smaller numbers. How do we interpret these numbers? Dividing runs by characters first of all gives us a factor. This one multiplied by 5 can give us a decent representation of how many runs the average character did during each season since most runs are done with 5 characters. A recent example would be: The average character in TWW S1 did about 36 M+ runs during the season, (7.23 x 5).
The numbers for Chinese data are obviously broken since a couple thousand players did probably more than 150,000 PuG runs around 200,000 random characters that for the most part are only listed with a single key entry.
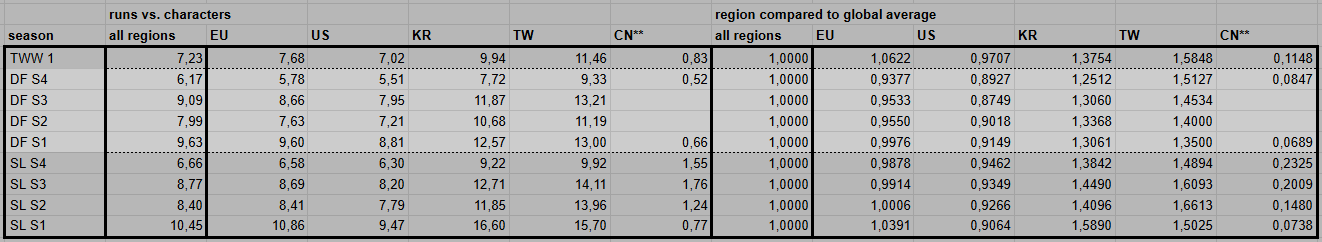
Filled into a graph we get a regular pattern of low engagement in short and lackluster seasons. Asian players are more active with each character than EU or US players. The pattern also suggests that people did fewer runs per character in TWW S1. This kind of reflects the general apathy towards the season. But it can also be attributed to fewer key levels being progressed and – towards the end of the season – fewer runs being required to get enough crests for upgrades.
Further Investigation Into Chinese Player Data in TWW S1
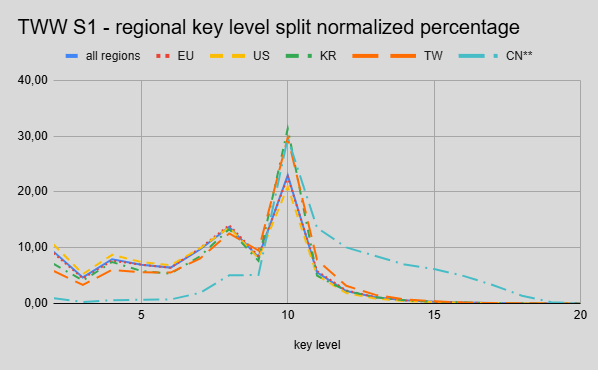
Looking at the leaderboard for the Chinese region in this season we see (at the moment of writing this article) 207,638 listed characters. If you were to scroll through all these pages one pattern clearly shows itself: The vast majority of these characters have only done or rather participated in a single run. The majority of these “single run characters” also show keys done between 8 and 11. This indicates that the Chinese users who are registered on Raider.IO did a lot of PuGs with complete randoms on farm key levels for their vault.
The graph of the key level split for each region is a perfect representation of this. In addition, we can see that Asian players in general have a bigger focus on Vault keys and everything beyond. Keep in mind that these curves are normalized. So all values summed up always result in 100% regardless of the absolute number of runs.
Comparing the data from the chinese leaderboard to other regions we get the following information:
- The CN top 40% are above 345 rating, the other 4 regions: 1960 – 2390
- The CN top 10% are above 1485 rating, the other 4 regions: 2650 – 2750
- The CN top 5% are above 2350 rating, other regions: 2750 – 2925
- The CN top 2% are above 3000 rating, finally catching up, other regions: 2960 – 3080
- The CN top 1% are above 3300 rating, higher the other regions: 3050 – 3180
- The CN top 0,1% are above 3645 while, other regions: 3460 – 3510
So what we can conclude from this peek into their activity is that the comparatively few players that take the effort to register on Raider.IO and upload their data are clearly focused on the top 1% rating regions if not higher. They managed to drag a massive amount of random characters into the metrics.
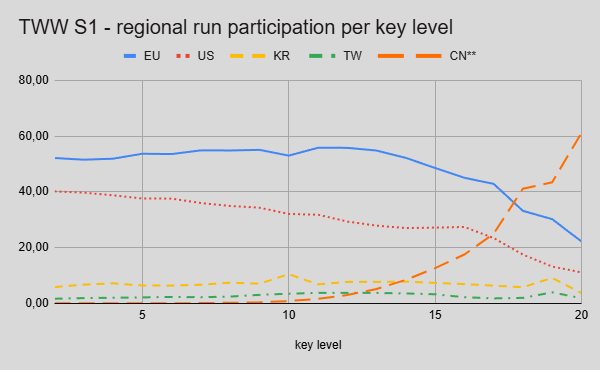
Chinese characters absolutely dominated the area above key level +16 shown by this regional participation breakdown by key level.
What We Have Gathered by Now
The perception of comparing data from this season to Dragonflight is heavily impacted by the activity of Chinese players or lack of evidence for it in general. It would be foolish to take data points from the fragmented TWW S1 and try to project the complete regional activity from them. Looking at the changes to Taiwanese data during Dragonflight we can make a few rough estimates.
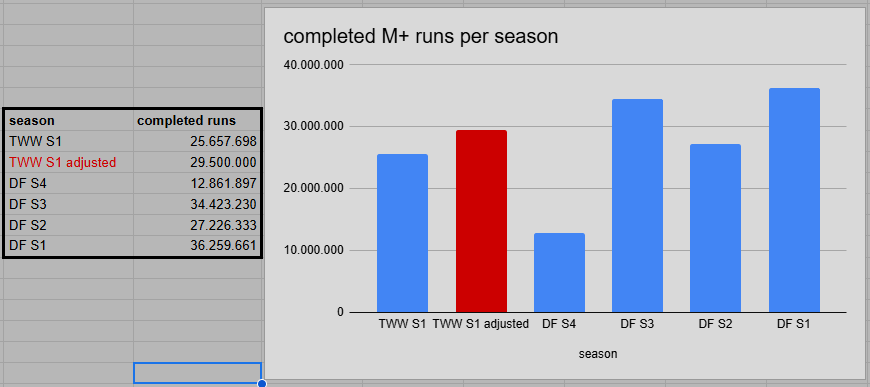
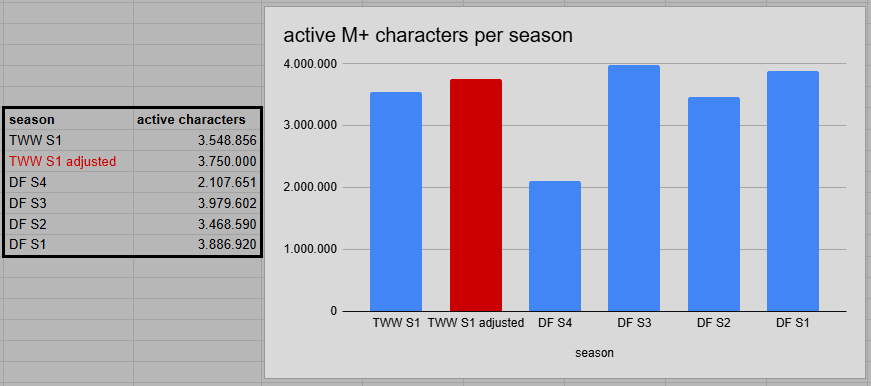
In general, the numbers of completed runs and active characters only went up season by season and even within individual seasons. The absolute peak would be DF S3 data with 6.35 million runs and 480,000 active characters. Without it we are looking at about 28 million runs and 3.5 million active characters. The equivalent 3% of the runs (840,000) and 2% of the characters (70,000) would be the baseline Taiwanese player activity. So on top of that, we can estimate 5,5 million additional runs and 410,000 additional active characters from the Chinese players for that season alone. And all of that under the restriction that players had to make the extra step of playing outside of their region which – given what we know about internet restrictions in China – isn’t such a trivial and quick decision.
Now we know of at least 200,000 active characters on Chinese servers by now and it isn’t too far of a stretch to assume that 400,000 characters were reactivated since the relaunch last year. A few thousand registered players would have a hard time running enough random keys to ensure having matched up with every other character within the region, especially given their focus on high end keys.
Now would these characters also produce 5.5 million M+ runs? Especially given the reduction in key levels and less farm effort for crests? The coefficient of “runs vs. characters” for Taiwanese data has been around 12 for the larger DF seasons while being closer to 8.5 on a global basis. By now these values have dropped to 11.46 and 7.23. With a lower estimate of 10 for Chinese players, we would still end up with around 4 million M+ runs for this region.
All in all, TWW S1 metrics would result in close to 30,000,000 completed runs and 3,75 million active characters. It is a rough estimate, but at least these numbers are a better starting point when comparing metrics with the Dragonflight seasons.
Final Conclusion
The War Within Season 1 has left a bitter taste for a lot of players. But in general, it seems to have performed quite well. Once people compare it to former seasons, there are always certain factors that can warp the numbers we see. We’ll probably never get the complete data on global Mythic+ activity, but at least now we are somewhat aware of how many more keys are being done and how many more characters are active.
In the final part of this seasonal analysis we will be looking at the general progression throughout the season in terms of QOL changes, hotfixes and other developer decisions to improve M+ during TWW S1 and for future seasons.