
We’re taking a closer look at Mythic+ participation numbers by comparing Dragonflight Season 4 with the ongoing War Within Season 1 that’s ending soon.
The Data
This post is based on data from Raider.IO generated by Zmiecer.
Weekly Mythic+ Runs: DF S4 vs. TWW S1
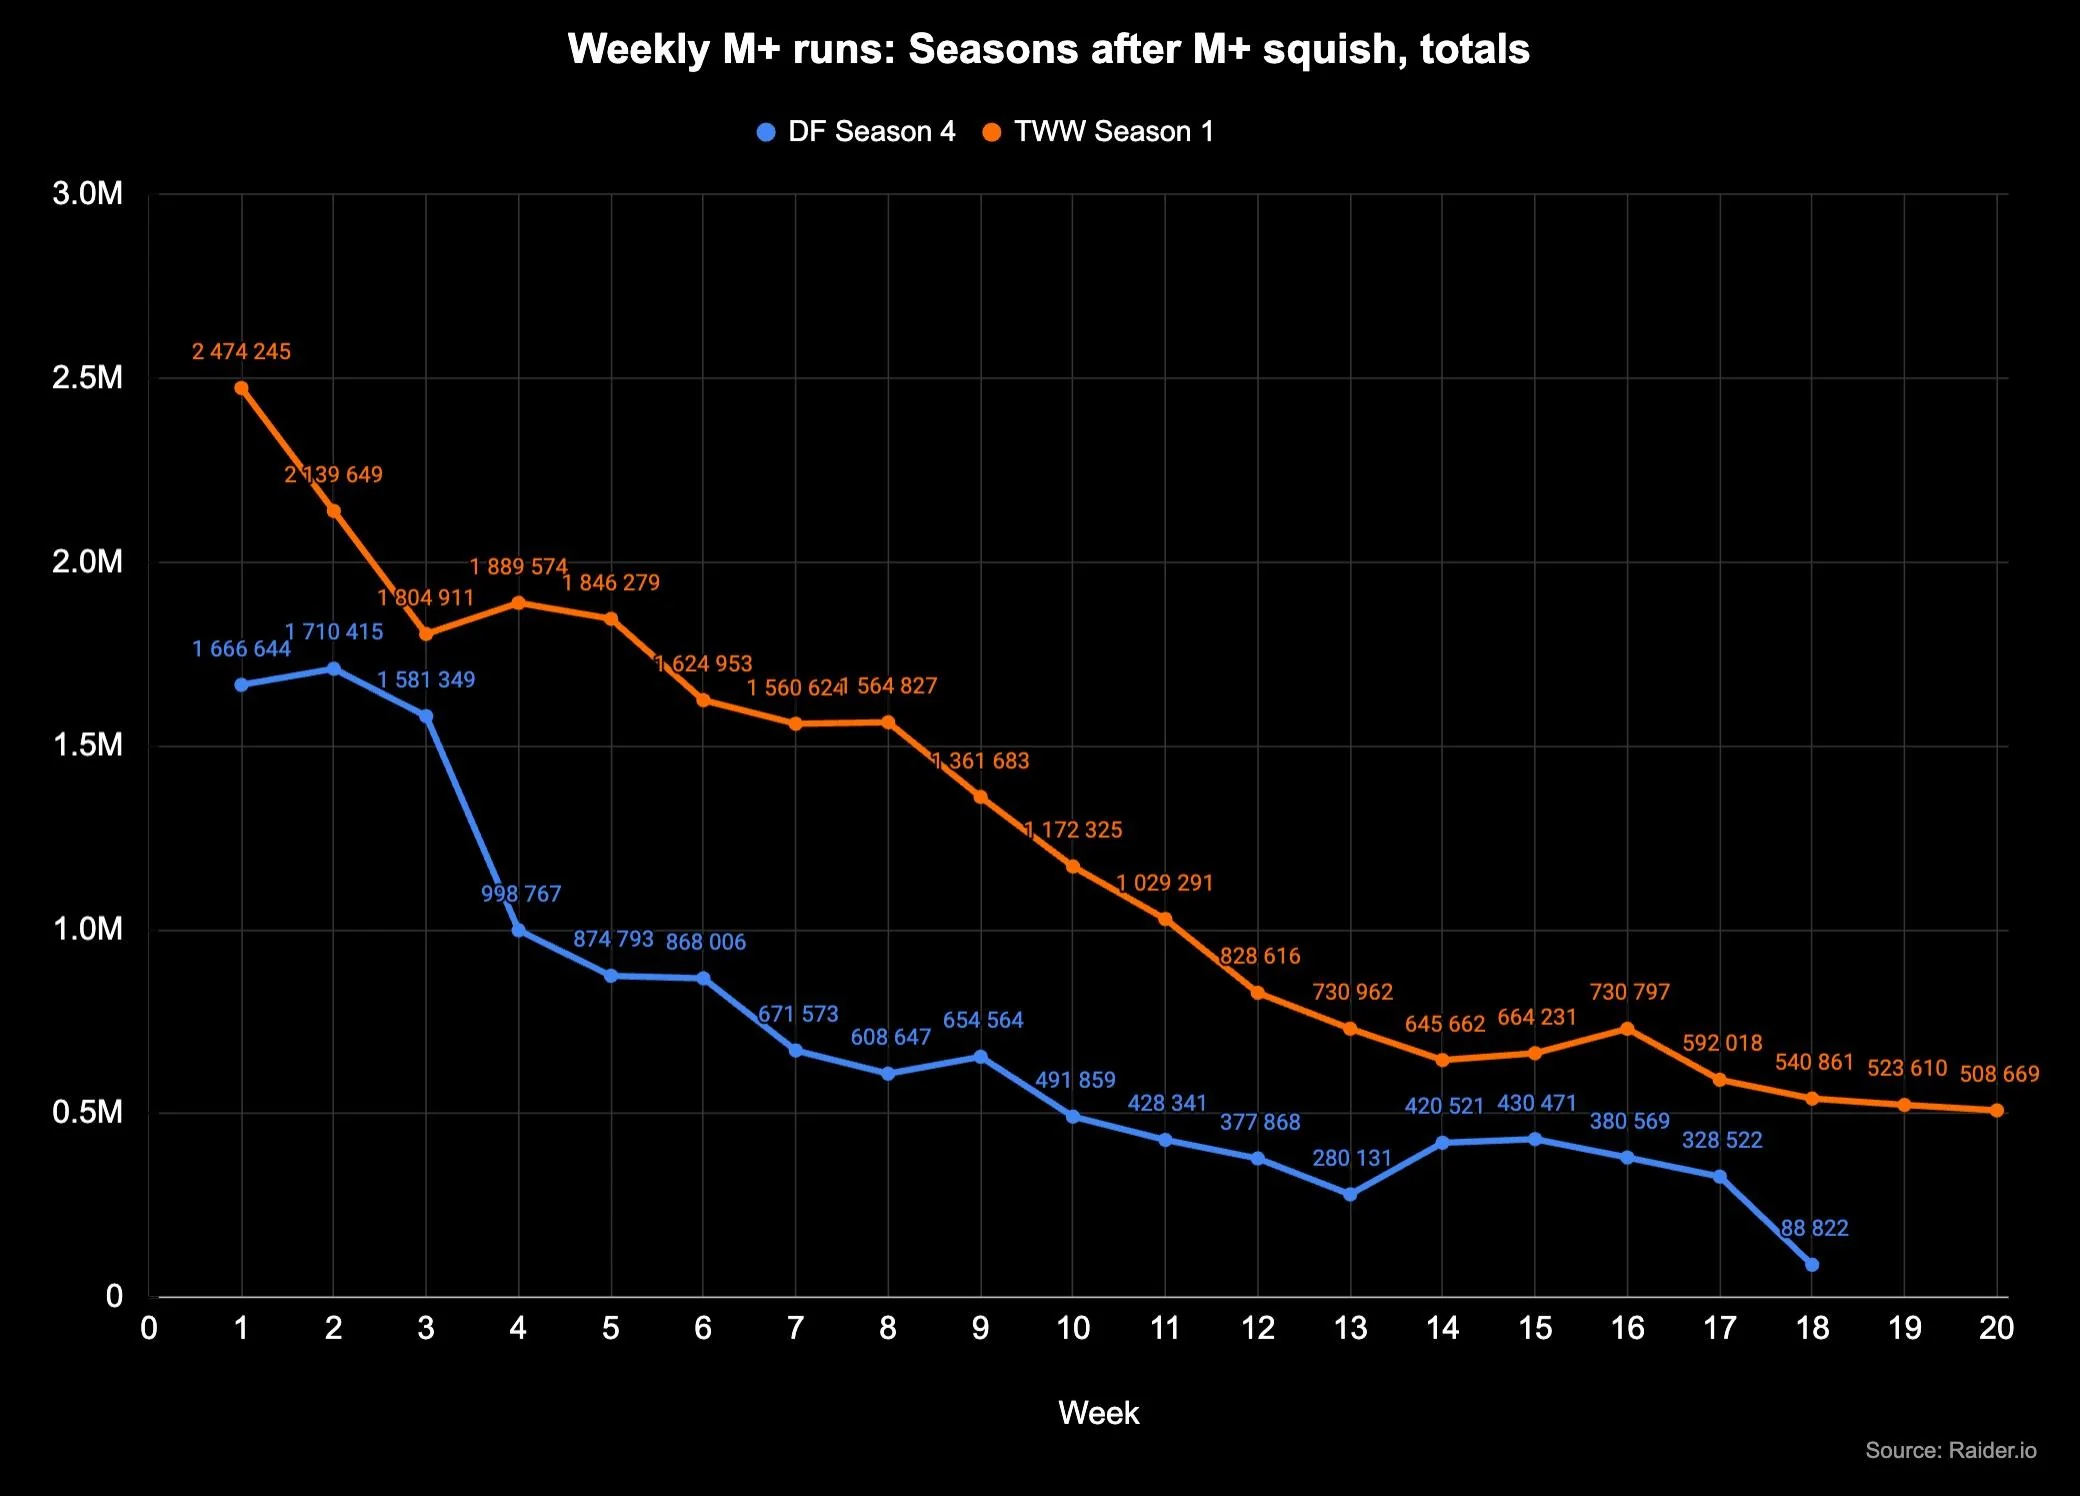
Here’s a week-by-week breakdown of the Mythic+ runs for both Dragonflight Season 4 and The War Within Season 1 based on the graph.
| Week | DF Season 4 Runs (Blue) | TWW Season 1 Runs (Orange) |
|---|---|---|
| 1 | 1,666,644 | 2,474,245 |
| 2 | 1,710,415 | 2,139,649 |
| 3 | 1,581,349 | 1,804,911 |
| 4 | 998,767 | 1,889,574 |
| 5 | 874,793 | 1,846,279 |
| 6 | 868,006 | 1,624,953 |
| 7 | 671,573 | 1,560,624 |
| 8 | 608,647 | 1,564,827 |
| 9 | 654,564 | 1,361,683 |
| 10 | 491,859 | 1,172,325 |
| 11 | 428,341 | 1,029,291 |
| 12 | 377,868 | 828,616 |
| 13 | 280,131 | 730,962 |
| 14 | 420,521 | 645,662 |
| 15 | 430,471 | 664,231 |
| 16 | 380,569 | 730,797 |
| 17 | 328,522 | 592,018 |
| 18 | 88,822 | 540,861 |
| 19 | N/A | 523,610 |
| 20 | N/A | 508,669 |
Initial Boom, Then a Decline
TWW Season 1 started significantly stronger with 2.47M runs compared to DF Season 4‘s 1.67M. Both seasons saw a major drop after Week 2, but TWW Season 1 retained a much higher engagement over time.
Mid-Season Retention Differences
By Week 10, TWW Season 1 was still at 1.17M runs, while DF Season 4 had already dropped to 491K. TWW Season 1’s retention was stronger in Weeks 6-12, maintaining over 1M runs for 10 weeks. DF Season 4 experienced a steep drop-off and lost nearly 80% of its early participation.
Late-Season Trends
By Week 17, TWW Season 1 still saw 592K runs, while DF Season 4 was already at 328K. The 18th week of TWW Season 1 saw 540k runs, while DF at the same point had 88K, indicating the ongoing season is far more interesting for players.
DF Season 4 lasted for only 18 weeks, so we don’t have any data beyond that. However, TWW S1 is still going strong with 508K runs during Week 20.